Nurse anesthetists earn the highest salary of all nursing types. In our CRNA salary article, we broke down the nurse anesthetist salary averages published by the Bureau of Labor Statistics. In this article, we’ll take a closer look at the top paying cities and surrounding metropolitan / non-metropolitan areas for nurses anesthetists, also known as CRNAs. (See other healthcare salaries here).
Top Paying Cities for Nurse Anesthetists
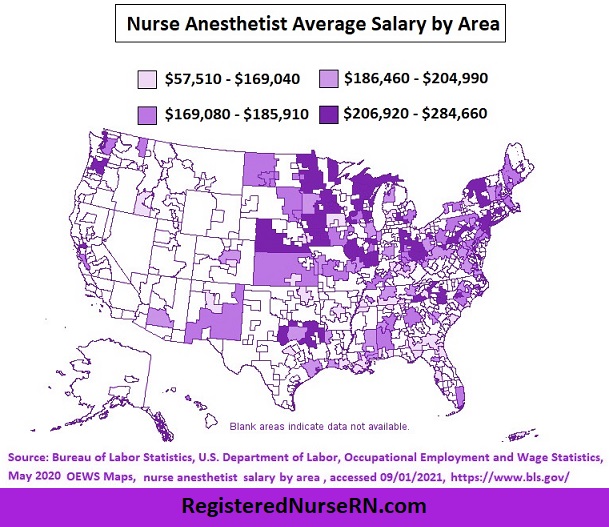
Here’s the map that shows the salary averages based on cities and their surrounding metropolitan and non-metropolitan areas. The white (blank) areas represent areas for which no salary data is available, and unfortunately, it there is not as much data as compared to the RN city salary averages.
Highest and Lowest Paying Cities for CRNAs
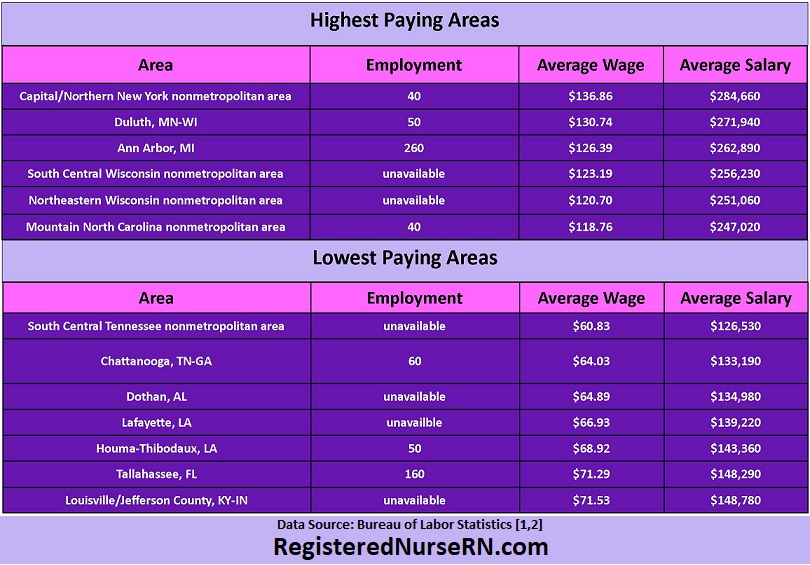
The highest paying city or metropolitan area was the Capital/Northern New York non-metropolitan area, which paid an average salary of $284,660 and an hourly wage of $136.86. Duluth, MN-WI was the second highest paying area, offering CRNAs an average salary of $271,940 and an hourly wage of $130.74.
The lowest paying area for CRNAs was the South Central, Tennessee non-metropolitan area, which paid an average salary of $126,530 and an average hourly wage of $60.83. Chattanooga, TN-GA area was next, offering CRNAs an average salary of $133,190 and hourly wage of $64.03. You can also view our article with the complete list of CRNA city salary data.
Nurse Anesthetist Salary for All Reported Cities (Metropolitan and Non-Metropolitan Areas)
Below is the complete list of salary, employment, and hourly wage data from nurse anesthetists in all reported cities and their surrounding metropolitan and non-metropolitan areas. This is sorted from highest to lowest, but some data is only partially available for certain areas.
| Area | Employment | Hourly Wage | Salary |
| Cape Girardeau, MO-IL | 40 | – | – |
| Carbondale-Marion, IL | 60 | – | – |
| Longview, TX | 50 | – | – |
| Los Angeles-Long Beach-Anaheim, CA | 360 | – | – |
| Capital/Northern New York nonmetropolitan area | 40 | $136.86 | $284,660 |
| Duluth, MN-WI | 50 | $130.74 | $271,940 |
| Ann Arbor, MI | 260 | $126.39 | $262,890 |
| South Central Wisconsin nonmetropolitan area | – | $123.19 | $256,230 |
| Northeastern Wisconsin nonmetropolitan area | – | $120.70 | $251,060 |
| Mountain North Carolina nonmetropolitan area | 40 | $118.76 | $247,020 |
| Southern Ohio nonmetropolitan area | 110 | $118.15 | $245,750 |
| Green Bay, WI | 70 | $114.97 | $239,140 |
| Vallejo-Fairfield, CA | 90 | $114.65 | $238,470 |
| Springfield, IL | 170 | $113.39 | $235,860 |
| East Central Illinois nonmetropolitan area | 40 | $112.44 | $233,870 |
| Northwest Minnesota nonmetropolitan area | 70 | $111.46 | $231,840 |
| Albany-Schenectady-Troy, NY | 180 | $109.98 | $228,750 |
| Fayetteville, NC | 40 | $109.27 | $227,280 |
| Portland-Vancouver-Hillsboro, OR-WA | 150 | $108.15 | $224,950 |
| Milwaukee-Waukesha-West Allis, WI | 260 | $107.79 | $224,210 |
| Charlotte-Concord-Gastonia, NC-SC | 730 | $107.16 | $222,900 |
| West Northwestern Ohio nonmetropolitan area | 40 | $105.77 | $219,990 |
| Hartford-West Hartford-East Hartford, CT | – | $105.22 | $218,870 |
| New York-Newark-Jersey City, NY-NJ-PA | 1,660 | $104.99 | $218,380 |
| Southeast Minnesota nonmetropolitan area | 80 | $103.92 | $216,160 |
| Southwest Iowa nonmetropolitan area | 40 | $103.87 | $216,050 |
| Upper Peninsula of Michigan nonmetropolitan area | – | $103.38 | $215,040 |
| Rochester, MN | – | $102.76 | $213,750 |
| Minneapolis-St. Paul-Bloomington, MN-WI | 850 | $102.68 | $213,570 |
| West Central Illinois nonmetropolitan area | 60 | $102.47 | $213,140 |
| Canton-Massillon, OH | 70 | $101.74 | $211,620 |
| Lansing-East Lansing, MI | 80 | $101.36 | $210,830 |
| Northwest Iowa nonmetropolitan area | – | $100.28 | $208,570 |
| North Texas Region of Texas nonmetropolitan area | – | $100.19 | $208,390 |
| Southern Pennsylvania nonmetropolitan area | 30 | $100.19 | $208,390 |
| Columbus, OH | 600 | $99.97 | $207,930 |
| Morgantown, WV | – | $99.94 | $207,870 |
| South Nebraska nonmetropolitan area | – | $99.91 | $207,810 |
| Des Moines-West Des Moines, IA | 80 | $99.48 | $206,920 |
| Rochester, NY | 100 | $98.55 | $204,990 |
| Birmingham-Hoover, AL | – | $98.43 | $204,740 |
| Portland-South Portland, ME | 140 | $98.11 | $204,080 |
| Madison, WI | 90 | $97.61 | $203,020 |
| Champaign-Urbana, IL | – | $97.32 | $202,420 |
| West Kentucky nonmetropolitan area | 30 | $97.29 | $202,370 |
| Urban Honolulu, HI | – | $97.08 | $201,930 |
| Kansas nonmetropolitan area | 40 | $96.73 | $201,200 |
| Southeast Iowa nonmetropolitan area | 50 | $96.68 | $201,090 |
| East South Dakota nonmetropolitan area | 50 | $96.43 | $200,570 |
| Fargo, ND-MN | 80 | $95.62 | $198,890 |
| Philadelphia-Camden-Wilmington, PA-NJ-DE-MD | 570 | $94.87 | $197,320 |
| West Central-Southwest New Hampshire nonmetropolitan area | 70 | $94.78 | $197,150 |
| Pittsburgh, PA | 200 | $94.15 | $195,830 |
| Seattle-Tacoma-Bellevue, WA | – | $93.99 | $195,510 |
| San Jose-Sunnyvale-Santa Clara, CA | 160 | $93.84 | $195,190 |
| Sioux Falls, SD | 200 | $93.78 | $195,070 |
| Detroit-Warren-Dearborn, MI | 1,350 | $93.61 | $194,710 |
| Columbia, MO | 90 | $93.59 | $194,660 |
| Boston-Cambridge-Nashua, MA-NH | 180 | $93.46 | $194,400 |
| Miami-Fort Lauderdale-West Palm Beach, FL | 1,740 | $93.05 | $193,540 |
| Southeast Coastal North Carolina nonmetropolitan area | 50 | $92.30 | $191,980 |
| Spokane-Spokane Valley, WA | 30 | $92.12 | $191,610 |
| Central Missouri nonmetropolitan area | – | $92.04 | $191,430 |
| Eastern New Mexico nonmetropolitan area | – | $91.89 | $191,130 |
| Northern Pennsylvania nonmetropolitan area | 40 | $91.53 | $190,370 |
| Baltimore-Columbia-Towson, MD | 320 | $91.50 | $190,320 |
| Southwest Maine nonmetropolitan area | – | $91.48 | $190,270 |
| West North Dakota nonmetropolitan area | 40 | $91.00 | $189,280 |
| Atlanta-Sandy Springs-Roswell, GA | 170 | $90.50 | $188,240 |
| Southwest Alabama nonmetropolitan area | – | $90.09 | $187,380 |
| Dayton, OH | – | $89.73 | $186,640 |
| Cincinnati, OH-KY-IN | 500 | $89.67 | $186,520 |
| Bismarck, ND | – | $89.64 | $186,460 |
| Houston-The Woodlands-Sugar Land, TX | 1,010 | $89.38 | $185,910 |
| Chambersburg-Waynesboro, PA | – | $89.20 | $185,540 |
| Augusta-Richmond County, GA-SC | – | $88.99 | $185,090 |
| Shreveport-Bossier City, LA | 120 | $88.68 | $184,460 |
| Scranton–Wilkes-Barre–Hazleton, PA | – | $87.98 | $182,990 |
| Denver-Aurora-Lakewood, CO | 170 | $87.66 | $182,330 |
| Southwest Minnesota nonmetropolitan area | – | $87.62 | $182,250 |
| Southern Vermont nonmetropolitan area | – | $87.43 | $181,850 |
| Buffalo-Cheektowaga-Niagara Falls, NY | 180 | $87.41 | $181,810 |
| Tuscaloosa, AL | 60 | $87.14 | $181,250 |
| Richmond, VA | 160 | $86.58 | $180,090 |
| Northern West Virginia nonmetropolitan area | – | $86.51 | $179,940 |
| Northwest Lower Peninsula of Michigan nonmetropolitan area | 90 | $86.23 | $179,350 |
| Knoxville, TN | – | $86.22 | $179,330 |
| Jackson, TN | 90 | $85.99 | $178,860 |
| Lake Charles, LA | 60 | $85.92 | $178,710 |
| Lexington-Fayette, KY | – | $85.62 | $178,080 |
| Washington-Arlington-Alexandria, DC-VA-MD-WV | 750 | $85.60 | $178,050 |
| Allentown-Bethlehem-Easton, PA-NJ | – | $85.28 | $177,380 |
| Phoenix-Mesa-Scottsdale, AZ | 70 | $84.45 | $175,650 |
| Gainesville, FL | – | $84.41 | $175,580 |
| Chicago-Naperville-Elgin, IL-IN-WI | 1,060 | $84.40 | $175,560 |
| Virginia Beach-Norfolk-Newport News, VA-NC | 260 | $84.37 | $175,480 |
| Hammond, LA | 30 | $84.25 | $175,250 |
| Southeast Mississippi nonmetropolitan area | 70 | $84.14 | $175,010 |
| Dallas-Fort Worth-Arlington, TX | 480 | $83.91 | $174,540 |
| Kansas City, MO-KS | 520 | $83.89 | $174,490 |
| Indianapolis-Carmel-Anderson, IN | 130 | $83.25 | $173,160 |
| Nashville-Davidson–Murfreesboro–Franklin, TN | – | $83.16 | $172,970 |
| Huntington-Ashland, WV-KY-OH | – | $82.90 | $172,440 |
| Gulfport-Biloxi-Pascagoula, MS | 60 | $82.61 | $171,840 |
| Eastern Ohio nonmetropolitan area | – | $82.45 | $171,500 |
| St. Louis, MO-IL | 340 | $82.15 | $170,870 |
| Raleigh, NC | 610 | $81.29 | $169,080 |
| Jacksonville, FL | 300 | $81.27 | $169,040 |
| Memphis, TN-MS-AR | 610 | $81.18 | $168,850 |
| Cleveland-Elyria, OH | 760 | $81.02 | $168,520 |
| Tulsa, OK | 230 | $80.55 | $167,550 |
| Colorado Springs, CO | – | $80.01 | $166,420 |
| Little Rock-North Little Rock-Conway, AR | – | $79.39 | $165,130 |
| Myrtle Beach-Conway-North Myrtle Beach, SC-NC | – | $79.07 | $164,470 |
| Grand Rapids-Wyoming, MI | 190 | $78.83 | $163,970 |
| Mansfield, OH | – | $78.75 | $163,790 |
| Syracuse, NY | 80 | $78.68 | $163,650 |
| Wichita, KS | – | $78.64 | $163,570 |
| Killeen-Temple, TX | 130 | $78.34 | $162,950 |
| Northeast Iowa nonmetropolitan area | 30 | $77.93 | $162,090 |
| Charleston-North Charleston, SC | 510 | $77.34 | $160,880 |
| Cape Coral-Fort Myers, FL | – | $76.66 | $159,460 |
| Omaha-Council Bluffs, NE-IA | 310 | $76.50 | $159,130 |
| Huntsville, AL | 300 | $76.43 | $158,970 |
| Central Kentucky nonmetropolitan area | – | $76.01 | $158,110 |
| Asheville, NC | 150 | $75.91 | $157,890 |
| New Orleans-Metairie, LA | 370 | $75.78 | $157,610 |
| Albuquerque, NM | 140 | $75.24 | $156,500 |
| Tampa-St. Petersburg-Clearwater, FL | – | $75.11 | $156,220 |
| Mobile, AL | 140 | $74.15 | $154,230 |
| Pensacola-Ferry Pass-Brent, FL | 160 | $72.35 | $150,480 |
| Boise City, ID | – | $72.16 | $150,080 |
| South Georgia nonmetropolitan area | – | $71.54 | $148,800 |
| Louisville/Jefferson County, KY-IN | – | $71.53 | $148,780 |
| Tallahassee, FL | 160 | $71.29 | $148,290 |
| Houma-Thibodaux, LA | 50 | $68.92 | $143,360 |
| Lafayette, LA | – | $66.93 | $139,220 |
| Dothan, AL | – | $64.89 | $134,980 |
| Chattanooga, TN-GA | 60 | $64.03 | $133,190 |
| South Central Tennessee nonmetropolitan area | – | $60.83 | $126,530 |
| San Juan-Carolina-Caguas, PR | 230 | $27.65 | $57,510 |
Data Sources:
- Bureau of Labor Statistics, U.S. Department of Labor, Occupational Employment and Wage Statistics, Nurse Anesthetists, May 2020 [www.bls.gov/]
- Bureau of Labor Statistics, U.S. Department of Labor, Occupational Employment and Wage Statistics, May 2020 OEWS Maps, Employment of Nurse Anesthetists, by state, May 2020, accessed 08/25/2021, [https://www.bls.gov/]