How much money does a nurse practitioner make per year or per hour? Do nurse practitioners (NPs), which are advanced practice registered nurses (APRNs), make good money for the extra schooling and training required? Let’s take a look at some salary statistics published by the Bureau of Labor Statistics [1,2].
Nurse Practitioner Average Salary
According to the Bureau of Labor Statistics [1,2], in May 2020, the average salary for a nurse practitioner was $114,510 per year or $55.05 per hour in the United Sates.
Again, these are only averages. The average height for a man in the U.S. is around 5’9”, but clearly some men are shorter and some are taller. Nurse practitioners may make more or less than these amounts, but these salary figures are the calculated averages published by the Bureau of Labor Statistics.

Nurse Practitioner Median Salary
The median salary for nurse practitioners, which is the middle number in the Bureau’s sorted data set, was $111,680 per year or $53.69 per hour in the U.S. in 2020.
Here are the percentile estimates for nurse practitioner income data. If you made $156,160 per year or 75.08 per hour, you were in the 90th percentile, meaning only an estimated 10% of nurse practitioners earned more than that in the United States.
- 10th percentile: $82,960 / $39.88
- 25th percentile: $94,890 / $45.62
- 50th percentile: $111,680 / $53.69
- 75th percentile: $130,240 / $62.62
- 90th percentile: $156,160 / $75.08
Again, many factors can influence your individual salary such as your location, years of experience, specialty, industry, and so forth. I’ll talk about some of those factors in a moment.
Nurse Practitioner Salary Growth
First, let’s take a look at how the nurse practitioner salary averages from the past few years, and I have calculated with the percentage increase from year to year for the last five years. The biggest jump in salary for nurse practitioners came in 2016, with a 3.308% increase from the previous year. The jump in hourly pay was also the biggest in 2016, with a 7.754% increase from 2015.

The pandemic didn’t seem to influence the salary too much, especially when compared to the registered nurse salary growth. but again, this latest data is from May 2020, so we’ll have to wait a year or two to see how it may have affected salary growth.
Highest and Lowest Paying States for Nurse Practitioners
Now let’s take a look at the states that paid the highest and lowest average salary to nurse practitioners. You can see from this map that the darker shades of purple represent the states that pay higher on average and the lighter shades paid less on average.
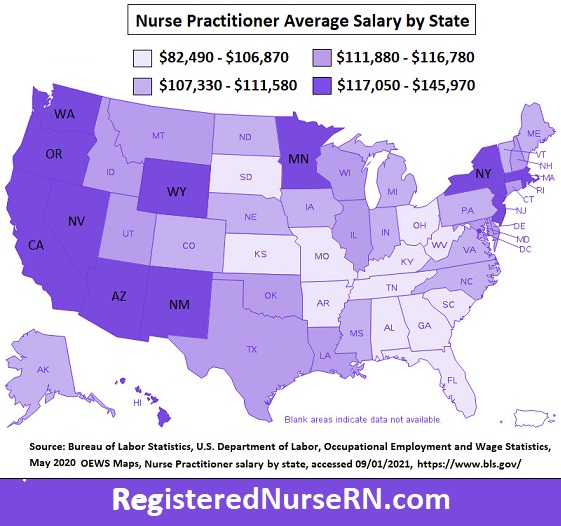
The highest paying state was California, paying an average salary of $145,970 and an average hourly wage of $70.18. New Jersey was the second highest paying state, offering $130,890 per year or $62.93 on average to nurse practitioners.
The lowest paying state was Tennessee, which paid nurse practitioners an average salary of $99,370 and an average hourly wage of $47.78 per hour. Alabama came in as the second lowest paying state, offering an average salary of $99,790 and an average wage of $47.98.
Nurse Practitioner Salary and Hourly Wage in Every State
Here’s a list of the average salary, wage, and employment numbers for each state and U.S. owned territory. California employed the most nurse practitioners in the country, as is the case with RNs. Some 15,100 nurse practitioners were estimated to work in that state.
| State | Employment | Hourly Pay Average | Average Salary |
| Alabama | 3,930 | $47.98 | $99,790 |
| Alaska | 770 | $53.01 | $110,270 |
| Arizona | 4,790 | $56.48 | $117,480 |
| Arkansas | 2,730 | $51.06 | $106,210 |
| California | 15,100 | $70.18 | $145,970 |
| Colorado | 3,080 | $52.77 | $109,760 |
| Connecticut | 2,630 | $56.15 | $116,780 |
| Delaware | 740 | $53.96 | $112,230 |
| District of Columbia | 860 | $55.84 | $116,150 |
| Florida | 13,010 | $48.58 | $101,060 |
| Georgia | 8,120 | $51.07 | $106,220 |
| Guam | 50 | $39.66 | $82,490 |
| Hawaii | 390 | $57.11 | $118,780 |
| Idaho | 810 | $54.76 | $113,890 |
| Illinois | 6,890 | $53.87 | $112,060 |
| Indiana | 5,700 | $52.86 | $109,940 |
| Iowa | 2,010 | $51.88 | $107,910 |
| Kansas | 2,580 | $50.25 | $104,530 |
| Kentucky | 4,250 | $49.26 | $102,460 |
| Louisiana | 3,170 | $53.79 | $111,880 |
| Maine | 1,360 | $53.64 | $111,580 |
| Maryland | 3,320 | $55.40 | $115,240 |
| Massachusetts | 6,430 | $60.60 | $126,050 |
| Michigan | 4,880 | $52.48 | $109,150 |
| Minnesota | 4,080 | $57.16 | $118,900 |
| Mississippi | 3,640 | $52.67 | $109,550 |
| Missouri | 6,200 | $51.38 | $106,870 |
| Montana | 710 | $54.99 | $114,370 |
| Nebraska | 1,500 | $51.60 | $107,330 |
| Nevada | 1,290 | $57.64 | $119,890 |
| New Hampshire | 1,060 | $54.07 | $112,460 |
| New Jersey | 5,800 | $62.93 | $130,890 |
| New Mexico | 1,080 | $56.28 | $117,050 |
| New York | 14,850 | $60.79 | $126,440 |
| North Carolina | 6,040 | $52.10 | $108,370 |
| North Dakota | 690 | $53.40 | $111,070 |
| Ohio | 9,430 | $50.78 | $105,630 |
| Oklahoma | 1,970 | $54.21 | $112,750 |
| Oregon | 2,220 | $57.02 | $118,600 |
| Pennsylvania | 8,150 | $53.64 | $111,560 |
| Rhode Island | 690 | $56.39 | $117,300 |
| South Carolina | 2,820 | $48.65 | $101,190 |
| South Dakota | 590 | $49.56 | $103,080 |
| Tennessee | 8,300 | $47.78 | $99,370 |
| Texas | 14,680 | $56.11 | $116,700 |
| Utah | 1,610 | $54.59 | $113,550 |
| Vermont | 460 | $52.06 | $108,280 |
| Virginia | 5,790 | $52.72 | $109,660 |
| Washington | 3,720 | $60.81 | $126,480 |
| West Virginia | 1,200 | $50.59 | $105,220 |
| Wisconsin | 4,820 | $54.34 | $113,030 |
| Wyoming | 340 | $57.12 | $118,810 |
Highest and Lowest Paying Cities for Nurse Practitioners
Now let’s take a look at the highest and lowest paying cities and their surrounding metropolitan and non-metropolitan areas for nurse practitioners (NPs) in the United States.
Again, looking at this map you can get a quick sense of the areas that paid the highest and lowest salary average, with no data available for the white areas.
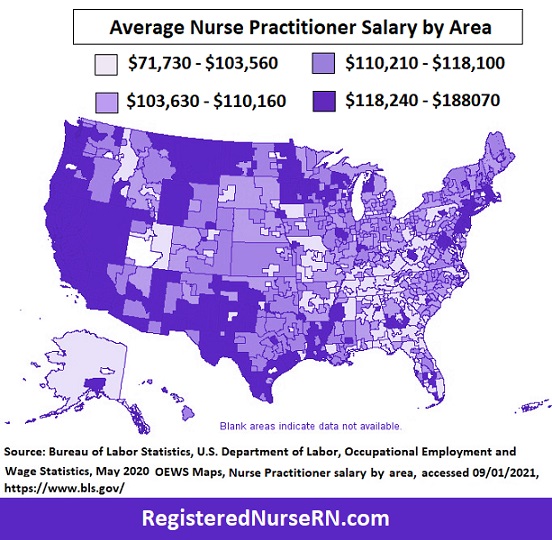
The highest paying city and surrounding area for nurse practitioners was the Vallejo –Fairfield, CA area, which paid an average salary of $188,070 and an hourly wage of $90.42. The San Francisco – Oakland – Hayward, CA area was the second highest paying area for nurse practitioners, offering a salary average of $177,800 and hourly pay of $85.48.
The lowest paying area reported in the United States was the Brunswick, GA area, which paid an average salary of $71,730 and hourly pay of $34.49. Punta Gorda, FL was a close second, paying an average salary of $72,120 and hourly pay of $34.67.

- NOTE: check out the nurse practitioner salary in major cities article if you’d like to look at the salary data in more detail.
Top Paying Industries
Which industries paid nurse practitioners the most money? Surprisingly, it was the “Community Food and Housing, and Emergency Relief Services” industry, which paid an average salary of $143,480 per year and 68.98 per hour.
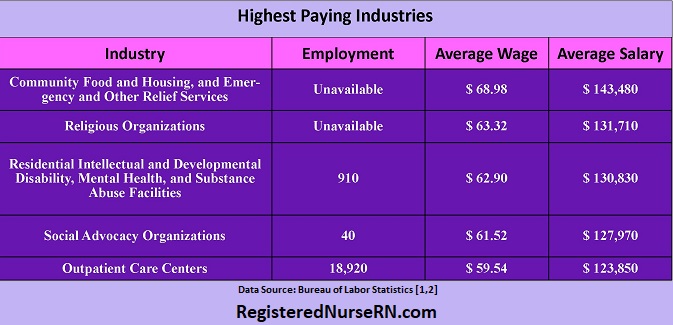
Religious organizations was next, offering an average of $131,710 and an hourly wage of $63.32.
Where do Most Nurse Practitioners Work?
Finally, let’s take a look at the income averages for the industries that employ most of the nurse practitioners in America. Offices of Physicians was the industry that employed most nurse practitioners, and an estimated 101,220 worked there and earned an average salary of $111,310 and an average wage of $53.51.
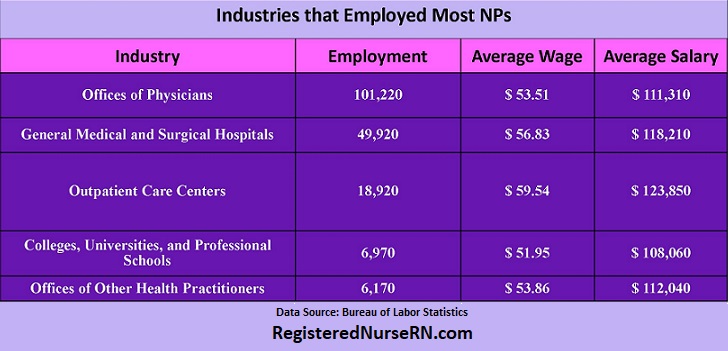
General Medical and Surgical Hospitals was next, employing an estimated 49,920 NPs and offering an average salary of $118,210 and hourly wage of $56.83. Keep reading to learn more about other healthcare salaries.
Works Cited:
- Bureau of Labor Statistics, U.S. Department of Labor, Occupational Employment and Wage Statistics, Nurse Practitioners, May 2020 [www.bls.gov/]
- Bureau of Labor Statistics, U.S. Department of Labor, Occupational Employment and Wage Statistics, May 2020 OEWS Maps, Employment of Nurse Practitioners, by state, May 2020, accessed 08/25/2021, [https://www.bls.gov/]