- Heart blood flow and its relationship with the electrical conduction system
- PQRST waveform and what it assesses
- Details and measurements of the ECG waveform
- Questions to ask when analyzing a heart rhythm
- Demonstration on how to analyze a heart rhythm
Lecture on ECG/EKG Interpretation Basics
Before we dive into how to interpret an ECG, we must go back and review the basics of the heart. First, let’s talk about how the blood flows through the heart.Basic Blood Flow of the Heart:
Heart blood flow starts on the right side of the heart with deoxygenated blood entering the right atrium, flowing through the tricuspid valve, into the right ventricle, up through the pulmonic valve, into the pulmonary artery, then into the lungs for gas exchange (the blood now is oxygenated), it now enters into the left side of the heart via the left atrium, down through the mitral valve, into the left ventricle, up through the aortic valve, into the aorta, and lastly throughout the body.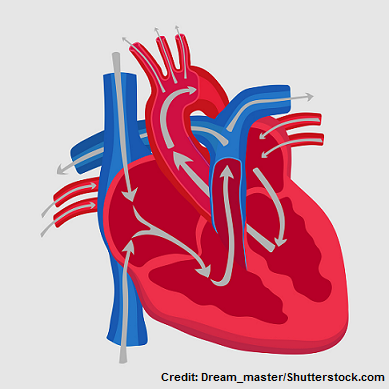 However, for your heart to pump the blood correctly it relies on the electrical conduction system. This system sends out jolts of electrical signals to the atria and ventricles causing them to contract and relax, which moves blood throughout the heart. This process is known as depolarization and repolarization of specific heart muscle cells that make up the atria and ventricles.
ECG/EKG Study Guide and Workbook for Nursing Students
You can get an eBook version here: “Nurse Sarah ECG Book” or a physical copy here: “ECG/EKG Interpretation Study Guide by Nurse Sarah“.
Heart Cells:
The heart cells I’m referring to are specialized heart cells that are part of the electrical conduction system of the heart. They make up the atria and ventricles and can receive electrical signals to cause the atria and ventricles to contract. When these cells are resting they are negatively charged, or another way of saying this is that they’re polarized. To get these cells to move (hence contract), they have to become depolarized (less negative) by an electrical stimulation. How does this happen? The cells become depolarized (hence contract) when the ion concentration is shifted. When the cell is resting there are more sodium ions on the outside of the cell than the inside, and they can’t get inside of the cell because of the impermeable cell membrane. But when the cell is stimulated (hence by electrical activity from let’s say the SA node) it causes the cell membrane to become receptive to sodium and sodium can now get inside. When sodium rushes inside the cell, it makes the cell positively charged, which changes its polarized state to a depolarized state, and this leads to the contraction of the heart cell. Then right after the heart cell contracts it needs to relax. This is referred to as repolarization. Repolarization is where the cell goes back to its negatively charged state on the inside (hence it repolarizes). Therefore, this leads the heart muscle cell to relax. **The take away from this is to remember that depolarization of the heart cells leads to contraction, and repolarization leads to relaxation (to keep them straight, remember that both repolarization and relaxation start with “re”.) This process of depolarization and repolarization creates the ECG reading, which is caused by the electrical conduction system of the heart.Electrical Conduction System of the Heart:
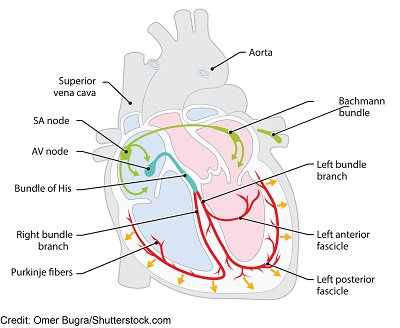 It all starts in the:
SA Node (sinoatrial node): this node is located in the upper part the right atrium and is known as the pacemaker of the heart, causing the heart to beat at 60-100 bpm. When this node fires, it sends electrical impulses to the atria causing atrial depolarization of the cells in the right and left atrium (remember depolarization causes the atria to contract). Then the electrical signals go to the:
AV node (atrioventricular node): this node is found in the lower part of the right atrium just above the tricuspid valve and is known as the “gatekeeper”.
The AV node is known for causing a delay in electrical signaling so the atria can fully empty their blood into the ventricles. If there wasn’t a delay, the atria would not fully empty its blood into the ventricles and this would cause problems.
Then it’s time for the ventricles to be depolarized (hence contract). So the electrical signal goes down to the Bundle of His, then the bundle branches (right and left) and lastly the Purkinje fibers, which causes the ventricles to depolarize. Shortly after this process, repolarization occurs and this process repeats itself over and over again.
**If the electrical conduction system sends out electrical signals like it’s supposed to (with the electrical signaling starting out in the SA node and traveling down throughout the system) it will create the rhythm known as Normal Sinus Rhythm on the ECG strip. However, if there are problems within this system, dysrhythmias can occur like atrial fibrillation, atrial flutter, v-tach, etc.
It all starts in the:
SA Node (sinoatrial node): this node is located in the upper part the right atrium and is known as the pacemaker of the heart, causing the heart to beat at 60-100 bpm. When this node fires, it sends electrical impulses to the atria causing atrial depolarization of the cells in the right and left atrium (remember depolarization causes the atria to contract). Then the electrical signals go to the:
AV node (atrioventricular node): this node is found in the lower part of the right atrium just above the tricuspid valve and is known as the “gatekeeper”.
The AV node is known for causing a delay in electrical signaling so the atria can fully empty their blood into the ventricles. If there wasn’t a delay, the atria would not fully empty its blood into the ventricles and this would cause problems.
Then it’s time for the ventricles to be depolarized (hence contract). So the electrical signal goes down to the Bundle of His, then the bundle branches (right and left) and lastly the Purkinje fibers, which causes the ventricles to depolarize. Shortly after this process, repolarization occurs and this process repeats itself over and over again.
**If the electrical conduction system sends out electrical signals like it’s supposed to (with the electrical signaling starting out in the SA node and traveling down throughout the system) it will create the rhythm known as Normal Sinus Rhythm on the ECG strip. However, if there are problems within this system, dysrhythmias can occur like atrial fibrillation, atrial flutter, v-tach, etc.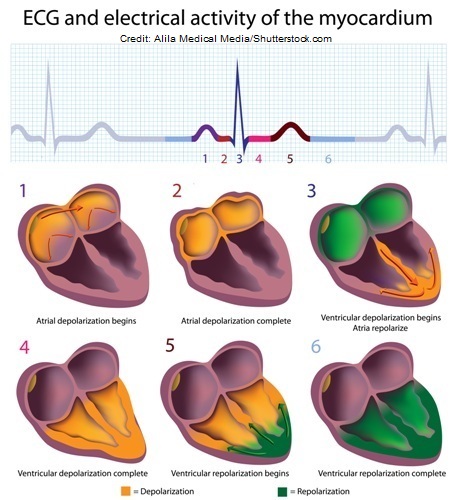
The ECG Waveform
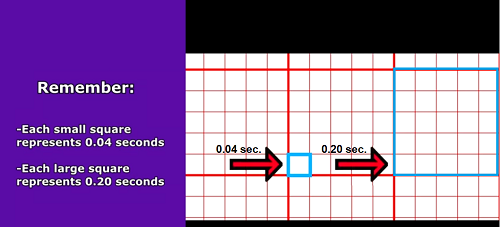
Found on the ECG is the ECG waveform (PQRST complex) and small/large boxes. First, the ECG strip paper is made up of small boxes that are contained within large squares. Each box represents a measurement of time. When you are starting out analyzing rhythms you have to be familiar with the basics on how to measure certain parts of the PQRST, counting the rate, regularity etc. Memorize:- each small square represents 0.04 seconds of time
- each large square has 5 small squares in it so it represents 0.20 seconds
JY FotoStock/shutterstock.com
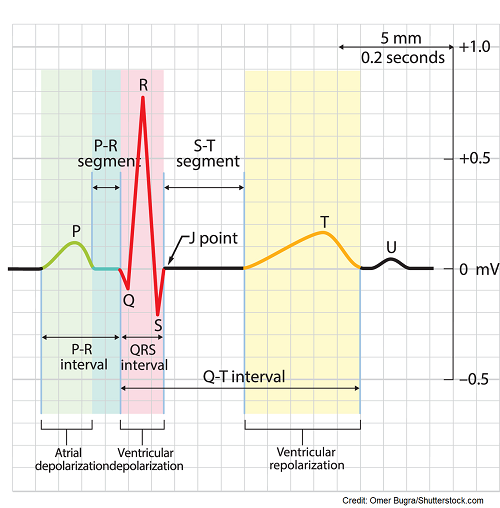 they must push it down to the ventricles by contracting. In other words, the p-wave is showing you that the atria are contracting.
PR segment (don’t confuse this with the PR interval): this demonstrates the delay created by the AV node (remember it’s the gatekeeper and gives the atria time to dump blood into the ventricles before they contract). It’s a flat line after the p-wave.
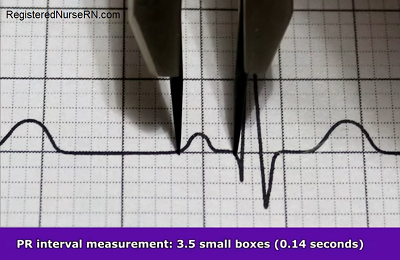
PR interval: this interval starts at the beginning of the p wave and extends to the beginning of the QRS complex. It demonstrates the amount of time it takes for the electrical signal to go from the atria to the AV node (if this is too long in time it could indicate a heart block). This is a part that is measured on the ECG.
QRS complex: this represents ventricle depolarization beginning which leads to the contraction of the ventricles and in this waveform is also atrial repolarization (relaxation of the atria), but it’s overshadowed by the large ventricles, so you can’t really see it. This is a part that is measured on the ECG.
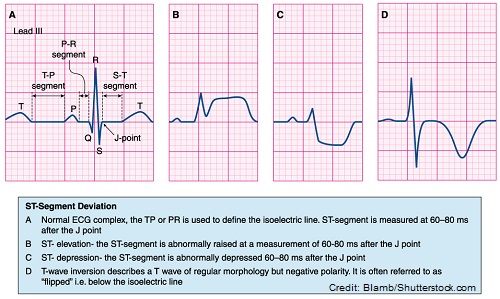
J-point: this is the point where the QRS complex meets the ST segment
ST segment: this represents the completion of ventricular depolarization and beginning of ventricle repolarization. It starts at the end of the QRS and ends at the beginning of the t-wave. The segment should be flat, hence isoelectric (no depression or elevation of more than 1 mm).
T wave: this represents the beginning of ventricular repolarization which leads to ventricle relaxation. The ventricles are so big that when they relax it creates the t wave.
QT interval: starts at the beginning of the QRS complex and ends after the t wave. It demonstrates the time it takes for electrical signals to cause the ventricles to contract and then rest. This is a part that is measured on the ECG.
*U-wave: not always present but may indicate hypokalemia or another abnormality in your patient.
they must push it down to the ventricles by contracting. In other words, the p-wave is showing you that the atria are contracting.
PR segment (don’t confuse this with the PR interval): this demonstrates the delay created by the AV node (remember it’s the gatekeeper and gives the atria time to dump blood into the ventricles before they contract). It’s a flat line after the p-wave.
PR interval: this interval starts at the beginning of the p wave and extends to the beginning of the QRS complex. It demonstrates the amount of time it takes for the electrical signal to go from the atria to the AV node (if this is too long in time it could indicate a heart block). This is a part that is measured on the ECG.
QRS complex: this represents ventricle depolarization beginning which leads to the contraction of the ventricles and in this waveform is also atrial repolarization (relaxation of the atria), but it’s overshadowed by the large ventricles, so you can’t really see it. This is a part that is measured on the ECG.
J-point: this is the point where the QRS complex meets the ST segment
ST segment: this represents the completion of ventricular depolarization and beginning of ventricle repolarization. It starts at the end of the QRS and ends at the beginning of the t-wave. The segment should be flat, hence isoelectric (no depression or elevation of more than 1 mm).
T wave: this represents the beginning of ventricular repolarization which leads to ventricle relaxation. The ventricles are so big that when they relax it creates the t wave.
QT interval: starts at the beginning of the QRS complex and ends after the t wave. It demonstrates the time it takes for electrical signals to cause the ventricles to contract and then rest. This is a part that is measured on the ECG.
*U-wave: not always present but may indicate hypokalemia or another abnormality in your patient.
Details on How Each Part Should Appear and Measure:
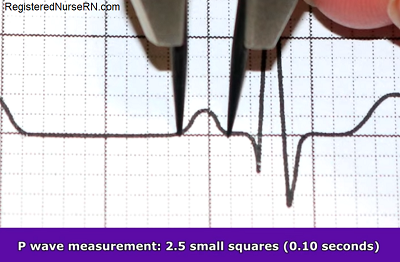
- One p-wave should be present and in front of every QRS complex, be upright and round, not flat
- Measurement should be less than 0.12 seconds (no more than 3 squares)

 T wave: should come after the QRS complex and be round and in the upright position in most leads


Regularity: are the p-waves occurring at the same regularity as the consecutive p-waves on the strip (this represents ATRIAL)…use a pair calipers to help with this
Atrial rate should be regular to be a normal sinus rhythm and means it is originating in the SA node Rate: Count the p-waves within that 6 second strip and multiple by 10…this is the atrial rate ATRIAL RATE should be AROUND 60-100 BPM for normal sinus rhythm Resemblance: How do they look? Only one p-wave in front of every QRS complex? Are they all identical in how they are round and pointing up and less than 0.12 seconds…less than 3 squares? Now the QRS: QRS complex: 3 R’s (Regularity, Rate, Resemblance)
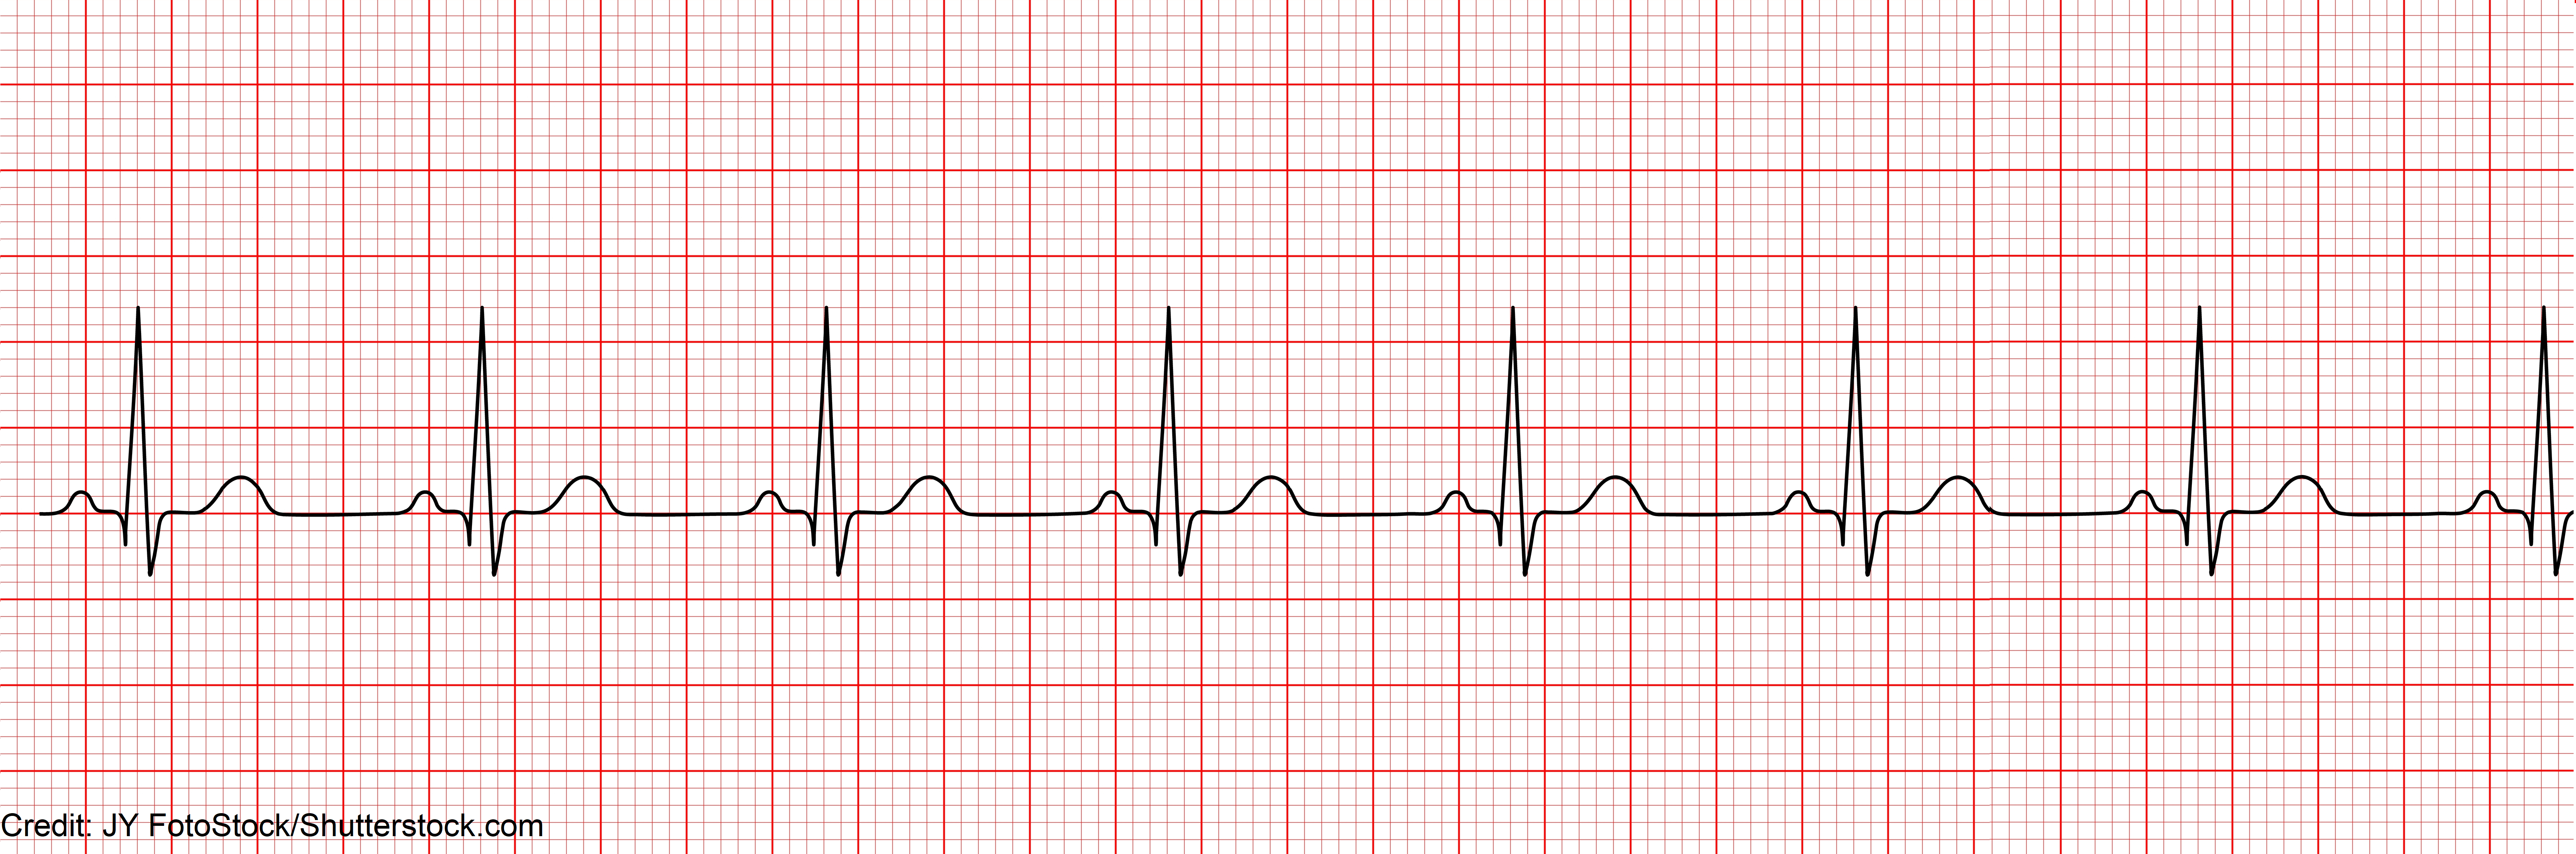 Use the questions above to guide you in analyzing this rhythm:
P-wave:
Use the questions above to guide you in analyzing this rhythm:
P-wave:
- Regularity: regular
- Rate: 80 bpm
- Resemblance: yes (p wave measurement: 0.10 seconds)
- Regularity: regular
- Rate: 80 bpm
- Resemblance: yes (QRS measurement: 0.10 seconds)
- Normal
References:
How the Heart Works | NHLBI, NIH. Retrieved 15 February 2022, from https://www.nhlbi.nih.gov/health-topics/how-heart-works
Sattar Y, Chhabra L. Electrocardiogram. [Updated 2021 Jul 31]. In: StatPearls [Internet]. Treasure Island (FL): StatPearls Publishing; 2022 Jan-. Available from: https://www.ncbi.nlm.nih.gov/books/NBK549803/