Certified nursing assistants’ salary average revealed: How much money do nursing assistants make per year or per hour?
CNA Job Duties
Certified nursing assistants (CNA) make up an integral part of the healthcare industry. They provide important care to patients, including the following:
- measuring and recording patient vital signs
- changing bed sheets
- feeding, bathing, and dressing patients
- assistant patients with mobility or transfers
- and much more
The exact duties of nursing assistants will vary, depending on the state in which the nursing assistant works. In many states, nursing assistants can obtain additional certifications that will increase their scope of practice, which will allow them to perform duties such as drawing bodily fluids or monitoring ECGs.
CNA Salary and Hourly Wage
According to the Bureau of Labor Statistics, in 2017, CNAs earned an average salary of $28,540 per year in the United States. The average hourly wage for CNAs was $13.72 per hour. The Bureau of Labor Statistics is also projecting an 11% growth rate for employment of nursing assistants between years 2016-2016, so the job outlook looks very good for this healthcare position.

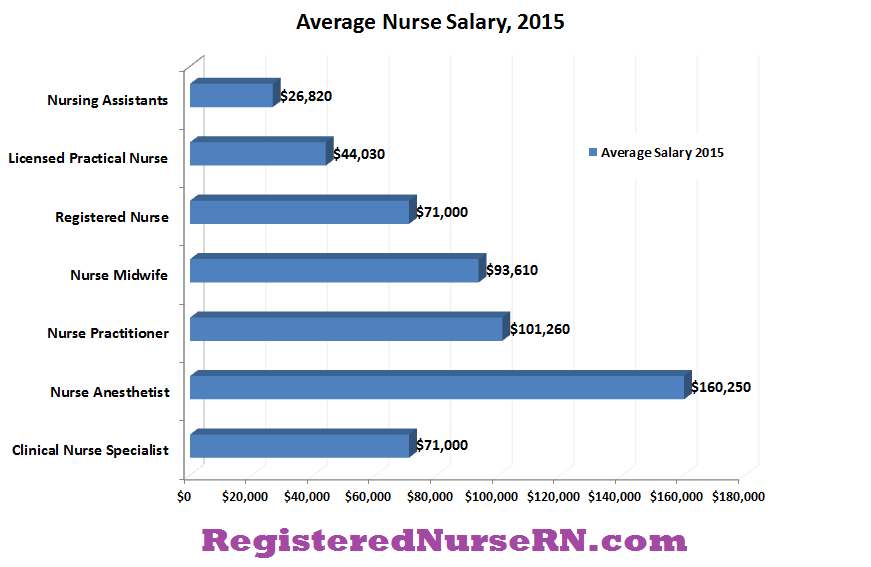
The latest salary average indicates a 6.41% increase in earnings when compared to the data released in 2015, which listed the average salary for nursing assistants at $26,820. You may want to view other healthcare salaries.
To gauge how your salary as a nursing assistant compares to other CNAs, you can view the percentile statistics below:
| Percentile | 10% | 25% | 50% (Median) |
75% | 90% |
| Hourly Wage | $9.94 | $11.22 | $13.23 | $15.49 | $18.57 |
| Annual Wage | $20,680 | $23,330 | $27,520 | $32,220 | $38,630 |
According to the chart above, if you earned $18.57 per hour, you earned more than 90% of nursing assistants in the United States in 2017, and only 10% earned more than you did.
Top Paying States for Nursing Assistants
Here are the states that reported the highest average salaries for CNAs.
| State | Employment | Employment per thousand jobs | Location quotient | Hourly mean wage | Annual mean wage |
| Alaska | 1,850 | 5.81 | 0.57 | $18.24 | $37,950 |
| New York | 94,980 | 10.32 | 1.01 | $16.87 | $35,080 |
| Nevada | 6,550 | 5.00 | 0.49 | $16.58 | $34,480 |
| District of Columbia | 3,160 | 4.46 | 0.44 | $16.43 | $34,170 |
| California | 98,570 | 5.90 | 0.58 | $16.13 | $33,560 |
CNA Salary for all 50 States
Alaska was the highest paying state for CNAs in 2017. The state paid nursing assistants an average salary of $37,950, and an average hourly wage of $18.24.
Louisiana was the lowest paying state for CNAs in 2017, with nursing assistants earning an average salary of $21,880 per year, and an average hourly wage of $10.52.
Keep in mind, however, that salary figures can be misleading without proper context. You must also consider things like the cost of living in each state. Furthermore, these numbers are only averages, and some CNAs may make more money, and others will make less than the listed amounts. Things like the individual’s experience, the state in which the individual works, additional certifications obtained, and the specific employment industry can affect annual earnings for nursing assistants.
Here are the salary and employment figures for all 50 states:
| State | Employment | Hourly mean wage | Annual mean wage |
| Alabama | 23,280 | $11.08 | $23,050 |
| Alaska | 1,850 | $18.24 | $37,950 |
| Arizona | 14,300 | $14.65 | $30,470 |
| Arkansas | 18,040 | $11.53 | $23,970 |
| California | 98,570 | $16.13 | $33,560 |
| Colorado | 20,540 | $15.41 | $32,040 |
| Connecticut | 21,710 | $15.85 | $32,970 |
| Delaware | 4,830 | $14.30 | $29,740 |
| District of Columbia | 3,160 | $16.43 | $34,170 |
| Florida | 92,190 | $12.47 | $25,930 |
| Georgia | 36,270 | $11.94 | $24,840 |
| Guam | 250 | $12.79 | $26,610 |
| Hawaii | 5,080 | $16.08 | $33,440 |
| Idaho | 7,470 | $12.72 | $26,450 |
| Illinois | 61,390 | $13.35 | $27,770 |
| Indiana | 31,520 | $12.53 | $26,070 |
| Iowa | 20,740 | $13.60 | $28,300 |
| Kansas | 22,590 | $12.16 | $25,290 |
| Kentucky | 23,880 | $12.46 | $25,920 |
| Louisiana | 20,550 | $10.52 | $21,880 |
| Maine | 9,070 | $13.10 | $27,250 |
| Maryland | 28,250 | $14.65 | $30,470 |
| Massachusetts | 38,370 | $15.55 | $32,340 |
| Michigan | 50,070 | $14.04 | $29,200 |
| Minnesota | 31,580 | $15.65 | $32,560 |
| Mississippi | 12,850 | $10.96 | $22,790 |
| Missouri | 40,190 | $12.19 | $25,360 |
| Montana | 6,170 | $13.01 | $27,070 |
| Nebraska | 14,540 | $13.29 | $27,650 |
| Nevada | 6,550 | $16.58 | $34,480 |
| New Hampshire | 8,270 | $14.91 | $31,000 |
| New Jersey | 56,660 | $14.14 | $29,400 |
| New Mexico | 6,190 | $13.00 | $27,050 |
| New York | 94,980 | $16.87 | $35,080 |
| North Carolina | 62,820 | $11.87 | $24,680 |
| North Dakota | 7,310 | $15.81 | $32,880 |
| Ohio | 66,160 | $12.85 | $26,740 |
| Oklahoma | 16,900 | $11.91 | $24,770 |
| Oregon | 12,800 | $15.48 | $32,190 |
| Pennsylvania | 75,020 | $14.43 | $30,010 |
| Puerto Rico | 370 | $9.91 | $20,610 |
| Rhode Island | 9,950 | $14.68 | $30,540 |
| South Carolina | 20,730 | $11.93 | $24,810 |
| South Dakota | 5,940 | $12.48 | $25,970 |
| Tennessee | 29,600 | $12.07 | $25,090 |
| Texas | 88,500 | $12.69 | $26,390 |
| Utah | 9,850 | $12.57 | $26,150 |
| Vermont | 3,290 | $14.29 | $29,720 |
| Virgin Islands | 200 | $13.31 | $27,690 |
| Virginia | 39,010 | $13.42 | $27,920 |
| Washington | 29,910 | $14.62 | $30,410 |
| West Virginia | 7,900 | $12.50 | $25,990 |
| Wisconsin | 33,230 | $13.86 | $28,830 |
| Wyoming | 3,070 | $14.41 | $29,970 |
Top Paying Industries for Nursing Assistants
| Industry | Employment | Percent of industry employment | Hourly mean wage | Annual mean wage |
| Federal Executive Branch | 14,140 | 0.70 | $18.43 | $38,340 |
| Facilities Support Services | 30 | 0.02 | $17.88 | $37,180 |
| Scientific Research and Development Services | 450 | 0.07 | $17.42 | $36,240 |
| Educational Support Services | 60 | 0.04 | $17.13 | $35,630 |
| Colleges, Universities, and Professional Schools | 3,110 | 0.10 | $16.49 | $34,290 |
CNA Salary and Employment by Industry
Here are the nursing assistant salary and employment figures for each industry, as reported by the BLS.
| Industry | Employment | Hourly mean wage | Annual mean wage |
| Cross-industry, Private, Federal, State, and Local Government | 1,453,670 | $13.72 | $28,540 |
| Cross-industry, Private Ownership Only | 1,324,160 | $13.59 | $28,270 |
| Sector 42 – Wholesale Trade | 40 | $12.43 | $25,850 |
| Merchant Wholesalers, Durable Goods | 40 | – | – |
| Professional and Commercial Equipment and Supplies Merchant Wholesalers | 40 | – | – |
| Sectors 44 and 45 – Retail Trade | – | $13.81 | $28,730 |
| Sector 51 – Information | 240 | – | – |
| Motion Picture and Sound Recording Industries | 240 | – | – |
| Motion Picture and Video Industries | 240 | – | – |
| Sector 52 – Finance and Insurance | 80 | $15.24 | $31,700 |
| Insurance Carriers and Related Activities | 80 | $15.16 | $31,530 |
| Insurance Carriers | 80 | $15.36 | $31,950 |
| Direct Health and Medical Insurance Carriers | 80 | $15.36 | $31,950 |
| Sector 54 – Professional, Scientific, and Technical Services | 520 | $16.72 | $34,770 |
| Professional, Scientific, and Technical Services | 520 | $16.72 | $34,770 |
| Management, Scientific, and Technical Consulting Services | – | $11.52 | $23,960 |
| Scientific Research and Development Services | 450 | $17.42 | $36,240 |
| Research and Development in the Physical, Engineering, and Life Sciences | 450 | $17.42 | $36,240 |
| Sector 55 – Management of Companies and Enterprises | 1,470 | $14.18 | $29,500 |
| Management of Companies and Enterprises | 1,470 | $14.18 | $29,500 |
| Management of Companies and Enterprises | 1,470 | $14.18 | $29,500 |
| Sector 56- Administrative and Support and Waste Management and Remediation Services | 39,570 | $13.88 | $28,870 |
| Administrative and Support Services | 39,570 | $13.88 | $28,870 |
| Facilities Support Services | 30 | $17.88 | $37,180 |
| Employment Services | 39,300 | $13.88 | $28,870 |
| Temporary Help Services | 33,890 | $13.91 | $28,930 |
| Sector 61 – Educational Services | 8,740 | $14.99 | $31,190 |
| Educational Services | 8,740 | $14.99 | $31,190 |
| Educational Services – State government owned | 2,330 | $15.76 | $32,780 |
| Educational Services – Local government owned | 4,980 | $14.49 | $30,130 |
| Educational Services – Privately owned | 1,430 | $15.52 | $32,290 |
| Elementary and Secondary Schools | 5,450 | $14.16 | $29,440 |
| Elementary and Secondary Schools – Local government owned | 4,610 | $14.24 | $29,620 |
| Elementary and Secondary Schools – Privately owned | 770 | $13.79 | $28,690 |
| Junior Colleges | 50 | $15.15 | $31,500 |
| Junior colleges – Local government owned | 30 | $13.94 | $28,990 |
| Colleges, Universities, and Professional Schools | 3,110 | $16.49 | $34,290 |
| Colleges, universities, and professional schools – State government owned | 2,250 | $15.84 | $32,950 |
| Colleges, universities, and professional schools – Local government owned | 310 | $17.91 | $37,240 |
| Colleges, universities, and professional schools – Privately owned | 560 | $18.30 | $38,060 |
| Educational Support Services | 60 | $17.13 | $35,630 |
| Educational Support Services – Privately owned | 30 | $16.46 | $34,240 |
| Sector 62 – Health Care and Social Assistance | 1,344,390 | $13.62 | $28,330 |
| Ambulatory Health Care Services | 119,870 | $13.66 | $28,400 |
| Offices of Physicians | 20,760 | $14.63 | $30,440 |
| Offices of Other Health Practitioners | 5,640 | $13.71 | $28,520 |
| Offices of Mental Health Practitioners | 40 | $11.66 | $24,260 |
| Offices of Physical, Occupational and Speech Therapists, and Audiologists | 4,030 | $12.97 | $26,980 |
| Offices of All Other Health Practitioners | 1,540 | $15.69 | $32,640 |
| Outpatient Care Centers | 13,330 | $15.47 | $32,180 |
| Outpatient Mental Health and Substance Abuse Centers | 1,070 | $13.53 | $28,150 |
| Medical and Diagnostic Laboratories | 350 | $14.02 | $29,160 |
| Home Health Care Services | 78,940 | $13.08 | $27,210 |
| Other Ambulatory Health Care Services | 800 | $13.63 | $28,350 |
| All Other Ambulatory Health Care Services | – | $13.78 | $28,670 |
| Hospitals | 399,500 | $14.72 | $30,630 |
| Hospitals – State government owned | 18,820 | $15.13 | $31,480 |
| Hospitals – Local government owned | 46,130 | $14.18 | $29,500 |
| Hospitals – Privately owned | 334,550 | $14.78 | $30,730 |
| General Medical and Surgical Hospitals | 365,360 | $14.73 | $30,640 |
| General Medical and Surgical Hospitals – State government owned | 13,100 | $15.63 | $32,520 |
| General Medical and Surgical Hospitals – Local government owned | 45,880 | $14.18 | $29,490 |
| General Medical and Surgical Hospitals – Privately owned | 306,380 | $14.77 | $30,730 |
| Psychiatric and Substance Abuse Hospitals | 7,610 | $13.63 | $28,350 |
| Psychiatric and Substance Abuse Hospitals – State government owned | 4,250 | $13.71 | $28,510 |
| Psychiatric and Substance Abuse Hospitals – Privately owned | 3,200 | $13.39 | $27,840 |
| Specialty Hospitals | 26,530 | $14.96 | $31,120 |
| Specialty hospitals – State government owned | 1,470 | $14.78 | $30,750 |
| Specialty hospitals – Privately owned | 24,970 | $14.98 | $31,160 |
| Nursing and Residential Care Facilities | 786,760 | $13.12 | $27,290 |
| Nursing Care Facilities | 594,460 | $13.20 | $27,470 |
| Residential Intellectual and Developmental Disability, Mental Health, and Substance Abuse Facilities | 23,680 | $12.97 | $26,990 |
| Residential Intellectual and Developmental Disability Facilities | 19,450 | $12.81 | $26,650 |
| Residential Mental Health and Substance Abuse Facilities | 4,240 | $13.72 | $28,550 |
| Continuing Care Retirement Communities and Assisted Living Facilities for the Elderly | 164,580 | $12.84 | $26,700 |
| Other Residential Care Facilities | 4,030 | $12.87 | $26,760 |
| Social Assistance | 38,260 | $12.32 | $25,630 |
| Individual and Family Services | 36,650 | $12.29 | $25,560 |
| Services for the Elderly and Persons with Disabilities | 33,720 | $12.11 | $25,190 |
| Community Food and Housing, and Emergency and Other Relief Services | 100 | $13.67 | $28,440 |
| Vocational Rehabilitation Services | 1,280 | $13.07 | $27,190 |
| Child Day Care Services | – | $13.12 | $27,300 |
| Sector 81 – Other Services | 1,100 | $14.26 | $29,660 |
| Religious, Grantmaking, Civic, Professional, and Similar Organizations | 1,080 | $14.27 | $29,690 |
| Religious Organizations | 820 | $14.73 | $30,630 |
| Grantmaking and Giving Services | 50 | $9.87 | $20,540 |
| Sector 99 – Federal, State, and Local Government | 57,260 | $15.72 | $32,700 |
| Federal, State, and Local Government | 57,260 | $15.72 | $32,700 |
| Federal, State, and Local Government, including government owned schools and hospitals | 129,520 | $15.04 | $31,290 |
| Federal Executive Branch | 14,140 | $18.43 | $38,340 |
| Federal government, including USPS | 14,140 | $18.43 | $38,340 |
| State Government, excluding schools and hospitals | 17,500 | $15.11 | $31,430 |
| State Government, including schools and hospitals | 38,650 | $15.16 | $31,530 |
| Local Government, excluding schools and hospitals | 25,620 | $14.64 | $30,460 |
| Local Government, including schools and hospitals | 76,730 | $14.36 | $29,860 |
References:
1. Bureau of Labor Statistics, U.S. Department of Labor, Occupational Outlook Handbook, 2017 Edition, Nursing Assistants, on the Internet at bls.gov.