LPN salary averages revealed: how much money does a licensed practical nurse, also called a licensed vocational nurse or LVN, make per year? Do LPNs earn a good income? What is an LPN’s salary or average hourly wage?
Let’s examine the latest data from the Bureau of Labor Statistics to find out.
LPN Job Outlook
First, let’s talk job growth. The job outlook also looks great for nursing students who plan to become an LPN. The Bureau of Labor Statistics is projecting a 12% growth rate for LPN/LVN employment between years 2016-2026, which exceeds the average for all occupations. [1]
LPN Salary Income
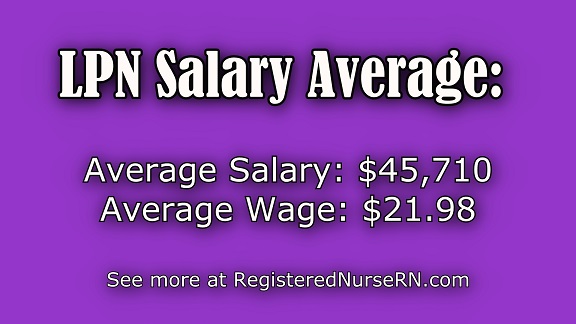
As of 2017, the average LPN salary was $45,710 per year. The median (middle) salary for LPNs was $45,030. LPNs earning more than $61,030 were in the 90% percentile, meaning that they made more than 90% of LPNs in the United States.
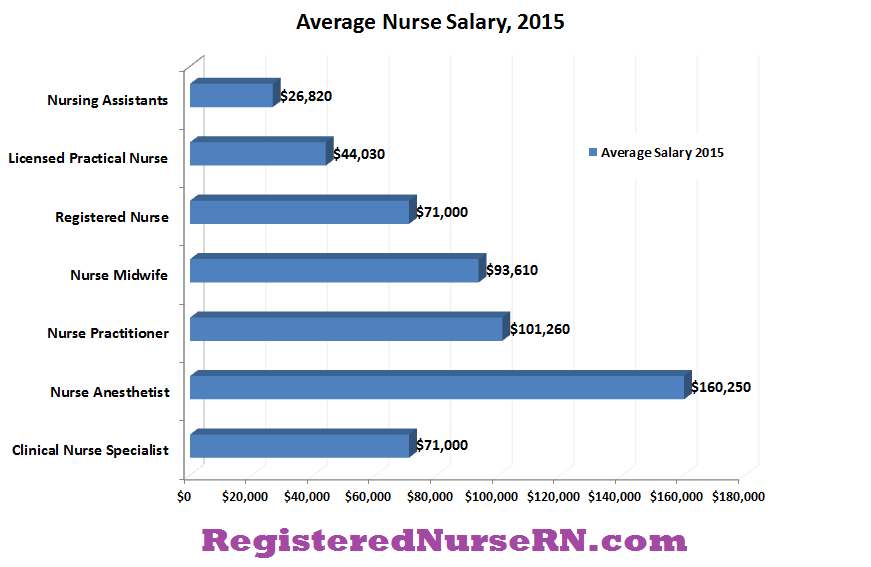
LPN salaries continue to increase each year. As an example, consider this graph showing nurse salaries from 2015, when LPNs earned an average salary of $44,030:
LPN Hourly Pay (Wages)
As of 2017, the average LPN hourly wage was $21.98. The median (middle) hourly wage for LPNs was $21.65. If you earned more than $29.34 per hour, you earned more than 90% of the LPNs in the United States.
If you’re an LPN who earns more (or less) than the averages listed above, you’re probably thinking, “That doesn’t look right! I make more (or less) than that!” However, these figures are only averages, and your salary can vary depending on factors like industry, experience, location, specialty, and more.
To help you gauge how your earnings compare to other LPNs in the United States, you can look the percentile estimates below:
LPN Income: Percentile Statistics
| Percentile | 10% | 25% | 50% (Median) |
75% | 90% |
| Hourly Wage | $15.85 | $18.27 | $21.65 | $25.11 | $29.34 |
| Annual Wage | $32,970 | $38,010 | $45,030 | $52,220 | $61,030 |
The above chart reveals the percentile earnings for LPN salary and wage data. If you earned $21.65 per hour or $45,030 per year in 2017, you made more than 50% of the LPNs in the U.S. If you earned $29.34 per hour or $61,030 per year, you earned more than 90% of the LPNs in the U.S.
LPN Salary for all 50 States
LPN pay can vary dramatically among the 50 U.S. states. Here are the average hourly wage and salary figures for LPNs in all 50 states and U.S. territories:
| LPN Salary for Every State (2017) | ||
| Area Name | Hourly mean wage | Annual mean wage |
| Alabama | $17.71 | $36,830 |
| Alaska | $27.20 | $56,580 |
| Arizona | $25.32 | $52,660 |
| Arkansas | $18.35 | $38,180 |
| California | $25.77 | $53,600 |
| Colorado | $23.91 | $49,740 |
| Connecticut | $27.51 | $57,210 |
| Delaware | $25.14 | $52,290 |
| District of Columbia | $25.50 | $53,050 |
| Florida | $20.90 | $43,480 |
| Georgia | $19.54 | $40,650 |
| Guam | $16.08 | $33,440 |
| Hawaii | $23.65 | $49,200 |
| Idaho | $20.18 | $41,980 |
| Illinois | $23.71 | $49,320 |
| Indiana | $20.40 | $42,440 |
| Iowa | $20.01 | $41,610 |
| Kansas | $20.32 | $42,260 |
| Kentucky | $19.64 | $40,860 |
| Louisiana | $18.52 | $38,530 |
| Maine | $21.44 | $44,590 |
| Maryland | $25.62 | $53,280 |
| Massachusetts | $27.79 | $57,800 |
| Michigan | $22.92 | $47,660 |
| Minnesota | $21.84 | $45,430 |
| Mississippi | $17.92 | $37,280 |
| Missouri | $19.80 | $41,180 |
| Montana | $20.52 | $42,690 |
| Nebraska | $20.01 | $41,620 |
| Nevada | $26.60 | $55,340 |
| New Hampshire | $24.11 | $50,150 |
| New Jersey | $26.37 | $54,840 |
| New Mexico | $23.11 | $48,060 |
| New York | $22.92 | $47,670 |
| North Carolina | $20.79 | $43,250 |
| North Dakota | $21.68 | $45,100 |
| Ohio | $20.35 | $42,340 |
| Oklahoma | $19.27 | $40,090 |
| Oregon | $24.54 | $51,040 |
| Pennsylvania | $22.63 | $47,070 |
| Puerto Rico | $11.35 | $23,610 |
| Rhode Island | $27.79 | $57,800 |
| South Carolina | $19.42 | $40,390 |
| South Dakota | $18.12 | $37,690 |
| Tennessee | $18.71 | $38,910 |
| Texas | $22.10 | $45,980 |
| Utah | $22.34 | $46,470 |
| Vermont | $23.34 | $48,560 |
| Virgin Islands | $20.76 | $43,190 |
| Virginia | $20.46 | $42,550 |
| Washington | $25.56 | $53,150 |
| West Virginia | $17.40 | $36,190 |
| Wisconsin | $21.21 | $44,120 |
| Wyoming | $22.49 | $46,780 |
The thing you have to remember about the state salary differences is that there can be various reasons for the income variations. For example, there is a greater demand for LPNs in some states because they have different laws and a different scope of practice than LPNs in other states.
However, keep in mind that some states have a high cost of living and different tax structures, so it doesn’t always make sense to move states solely based on income averages. You have to crunch numbers and consider all the factors involved to see if it makes financial sense.
Furthermore, you can always grow your LPN income by seeking certifications or working in higher paying industries in your current state. In addition, you could also consider going back to school to become an RN or advanced practice registered nurse, such as a nurse practitioner, CRNA, nurse midwife, etc. By taking a look at our nursing salaries, you can understand salary-earning potential with the different scopes of practice within the nursing profession.
Industry with highest levels of employment for LPNs
| Industry | Employment | Percent of industry employment | Hourly mean wage | Annual mean wage |
| Nursing Care Facilities (Skilled Nursing Facilities) | 208,740 | 12.87 | $22.61 | $47,030 |
| Offices of Physicians | 94,610 | 3.71 | $20.42 | $42,470 |
| General Medical and Surgical Hospitals | 91,770 | 1.67 | $21.23 | $44,150 |
| Home Health Care Services | 88,480 | 6.34 | $22.27 | $46,320 |
| Continuing Care Retirement Communities and Assisted Living Facilities for the Elderly | 50,960 | 5.58 | $22.46 | $46,710 |
Top Paying Metropolitan areas in the United States
Metropolitan areas will typically have more patients and a greater demand for all types of healthcare workers, including licensed practical nurses. Below are the top paying metropolitan areas in the U.S.
| Metropolitan area | Employment | Hourly mean wage | Annual mean wage |
| San Francisco-Redwood City-South San Francisco, CA Metropolitan Division | 2,270 | $31.25 | $65,000 |
| Boston-Cambridge-Newton, MA NECTA Division | 6,310 | $30.49 | $63,420 |
| San Jose-Sunnyvale-Santa Clara, CA | 2,920 | $29.50 | $61,360 |
| Salinas, CA | 650 | $29.00 | $60,330 |
| Bridgeport-Stamford-Norwalk, CT | 1,530 | $28.67 | $59,640 |
| Santa Rosa, CA | 710 | $28.57 | $59,430 |
| Napa, CA | 210 | $28.49 | $59,250 |
| Lynn-Saugus-Marblehead, MA NECTA Division | 280 | $28.19 | $58,640 |
| Oakland-Hayward-Berkeley, CA Metropolitan Division | 4,630 | $28.17 | $58,590 |
| Peabody-Salem-Beverly, MA NECTA Division | 540 | $28.10 | $58,450 |
LPN Income Based on Industry
Some industries pay higher wages than other industries do. Here are some of the LPN income statistics based on industry sector:
| LPN Earnings by Industry (2017) | ||
| Occupation |
Hourly mean wage | Annual mean wage |
| Health and Personal Care Stores | $21.39 | $44,490 |
| Health and Personal Care Stores | $21.39 | $44,490 |
| Pharmacies and Drug Stores | $23.92 | $49,760 |
| Sector 52 – Finance and Insurance | $25.29 | $52,590 |
| Insurance Carriers and Related Activities | $25.29 | $52,600 |
| Insurance Carriers | $25.56 | $53,160 |
| Direct Health and Medical Insurance Carriers | $25.37 | $52,760 |
| Agencies, Brokerages, and Other Insurance Related Activities | $24.28 | $50,500 |
| Other Insurance Related Activities | $24.29 | $50,530 |
| Sector 53 – Real Estate and Rental and Leasing | $22.11 | $45,990 |
| Rental and Leasing Services | $21.68 | $45,090 |
| Rental and Leasing Services | $21.68 | $45,090 |
| Sector 54 – Professional, Scientific, and Technical Services | $21.78 | $45,300 |
| Professional, Scientific, and Technical Services | $21.78 | $45,300 |
| Accounting, Tax Preparation, Bookkeeping, and Payroll Services | $20.18 | $41,970 |
| Management, Scientific, and Technical Consulting Services | $24.36 | $50,660 |
| Scientific Research and Development Services | $20.98 | $43,650 |
| Research and Development in the Physical, Engineering, and Life Sciences | $20.98 | $43,650 |
| Other Professional, Scientific, and Technical Services | $22.12 | $46,010 |
| Sector 55 – Management of Companies and Enterprises | $21.67 | $45,070 |
| Management of Companies and Enterprises | $21.67 | $45,070 |
| Management of Companies and Enterprises | $21.67 | $45,070 |
| Sector 56- Administrative and Support and Waste Management and Remediation Services | $22.65 | $47,110 |
| Administrative and Support Services | $22.65 | $47,110 |
| Office Administrative Services | $22.50 | $46,800 |
| Facilities Support Services | $21.17 | $44,040 |
| Employment Services | $22.69 | $47,200 |
| Temporary Help Services | $22.69 | $47,190 |
| Business Support Services | $23.31 | $48,490 |
| Sector 61 – Educational Services | $19.55 | $40,660 |
| Educational Services | $19.55 | $40,660 |
| Educational Services – State government owned | $20.76 | $43,170 |
| Educational Services – Local government owned | $18.83 | $39,170 |
| Educational Services – Privately owned | $21.44 | $44,590 |
| Elementary and Secondary Schools | $18.99 | $39,490 |
| Elementary and Secondary Schools – State government owned | $18.80 | $39,110 |
| Elementary and Secondary Schools – Local government owned | $18.79 | $39,080 |
| Elementary and Secondary Schools – Privately owned | $21.68 | $45,080 |
| Junior Colleges (including private, state, and local government schools) | $24.38 | $50,710 |
| Colleges, Universities, and Professional Schools | $20.87 | $43,400 |
| Colleges, universities, and professional schools – State government owned | $20.77 | $43,200 |
| Colleges, universities, and professional schools – Privately owned | $21.20 | $44,090 |
| Technical and Trade Schools | $20.81 | $43,290 |
| Technical and trade schools – Privately owned | $16.95 | $35,250 |
| Educational Support Services | $19.20 | $39,940 |
| Educational Support Services – Local government owned | $18.82 | $39,150 |
| Educational Support Services – Privately owned | $19.68 | $40,930 |
| Sector 62 – Health Care and Social Assistance | $21.97 | $45,690 |
| Ambulatory Health Care Services | $21.53 | $44,790 |
| Offices of Physicians | $20.42 | $42,470 |
| Offices of Dentists | $20.74 | $43,130 |
| Offices of Other Health Practitioners | $21.75 | $45,250 |
| Offices of Chiropractors | $16.47 | $34,250 |
| Offices of Optometrists | $17.34 | $36,060 |
| Offices of Mental Health Practitioners (except Physicians) | $21.15 | $43,990 |
| Offices of Physical, Occupational and Speech Therapists, and Audiologists | $23.33 | $48,520 |
| Offices of All Other Health Practitioners | $21.05 | $43,780 |
| Outpatient Care Centers | $23.14 | $48,120 |
| Outpatient Mental Health and Substance Abuse Centers | $20.96 | $43,590 |
| Medical and Diagnostic Laboratories | $22.75 | $47,320 |
| Home Health Care Services | $22.27 | $46,320 |
| Other Ambulatory Health Care Services | $21.23 | $44,150 |
| All Other Ambulatory Health Care Services | $21.35 | $44,400 |
| Hospitals (including private, state, and local government hospitals) | $21.49 | $44,690 |
| Hospitals – State government owned | $22.28 | $46,340 |
| Hospitals – Local government owned | $20.38 | $42,390 |
| Hospitals – Privately owned | $21.68 | $45,090 |
| General Medical and Surgical Hospitals | $21.23 | $44,150 |
| General Medical and Surgical Hospitals – State government owned | $24.22 | $50,370 |
| General Medical and Surgical Hospitals – Local government owned | $20.38 | $42,390 |
| General Medical and Surgical Hospitals – Privately owned | $21.37 | $44,450 |
| Psychiatric and Substance Abuse Hospitals | $21.57 | $44,860 |
| Psychiatric and Substance Abuse Hospitals – State government owned | $21.54 | $44,810 |
| Psychiatric and Substance Abuse Hospitals – Privately owned | $21.60 | $44,940 |
| Specialty (except Psychiatric and Substance Abuse) Hospitals | $24.23 | $50,400 |
| Specialty hospitals – State government owned | $20.99 | $43,660 |
| Specialty hospitals – Privately owned | $24.39 | $50,730 |
| Nursing and Residential Care Facilities | $22.52 | $46,850 |
| Nursing Care Facilities (Skilled Nursing Facilities) | $22.61 | $47,030 |
| Residential Intellectual and Developmental Disability, Mental Health, and Substance Abuse Facilities | $21.35 | $44,410 |
| Residential Intellectual and Developmental Disability Facilities | $20.95 | $43,580 |
| Residential Mental Health and Substance Abuse Facilities | $21.92 | $45,600 |
| Continuing Care Retirement Communities and Assisted Living Facilities for the Elderly | $22.46 | $46,710 |
| Other Residential Care Facilities | $21.42 | $44,550 |
| Social Assistance | $21.43 | $44,570 |
| Individual and Family Services | $21.39 | $44,480 |
| Services for the Elderly and Persons with Disabilities | $21.36 | $44,420 |
| Community Food and Housing, and Emergency and Other Relief Services | $21.99 | $45,730 |
| Vocational Rehabilitation Services | $21.01 | $43,690 |
| Child Day Care Services | $23.19 | $48,230 |
| Sector 71 – Arts, Entertainment, and Recreation | $22.35 | $46,480 |
| Amusement, Gambling, and Recreation Industries | $23.22 | $48,300 |
| Other Amusement and Recreation Industries | $23.66 | $49,210 |
| Fitness and Recreational Sports Centers | $23.66 | $49,210 |
| Sector 72 – Accommodation and Food Services | $19.49 | $40,540 |
| Accommodation | $19.49 | $40,540 |
| Sector 81 – Other Services (except Federal, State, and Local Government) | $23.03 | $47,910 |
| Personal and Laundry Services | $22.58 | $46,970 |
| Personal Care Services | $22.58 | $46,970 |
| Religious, Grantmaking, Civic, Professional, and Similar Organizations | $23.13 | $48,100 |
| Religious Organizations | $24.42 | $50,800 |
| Grantmaking and Giving Services | $20.16 | $41,940 |
| Social Advocacy Organizations | $21.60 | $44,920 |
| Civic and Social Organizations | $17.87 | $37,180 |
| Sector 99 – Federal, State, and Local Government (OES Designation) | $22.47 | $46,740 |
| Federal, State, and Local Government (OES Designation) | $22.47 | $46,740 |
| Federal, State, and Local Government, including government owned schools and hospitals | $21.46 | $44,640 |
| Federal Executive Branch (OES Designation) | $23.25 | $48,370 |
| Federal government, including USPS | $23.25 | $48,370 |
| State Government, excluding schools and hospitals (OES Designation) | $22.41 | $46,620 |
| State Government, including schools and hospitals | $22.13 | $46,020 |
| Local Government, excluding schools and hospitals (OES Designation) | $21.38 | $44,470 |
| Local Government, including schools and hospitals | $20.29 | $42,210 |
References:
1. Bureau of Labor Statistics, U.S. Department of Labor, Occupational Outlook Handbook, 2017 Edition, Licensed Practical Nurses, on the Internet at bls.gov.